
2.9 KiB
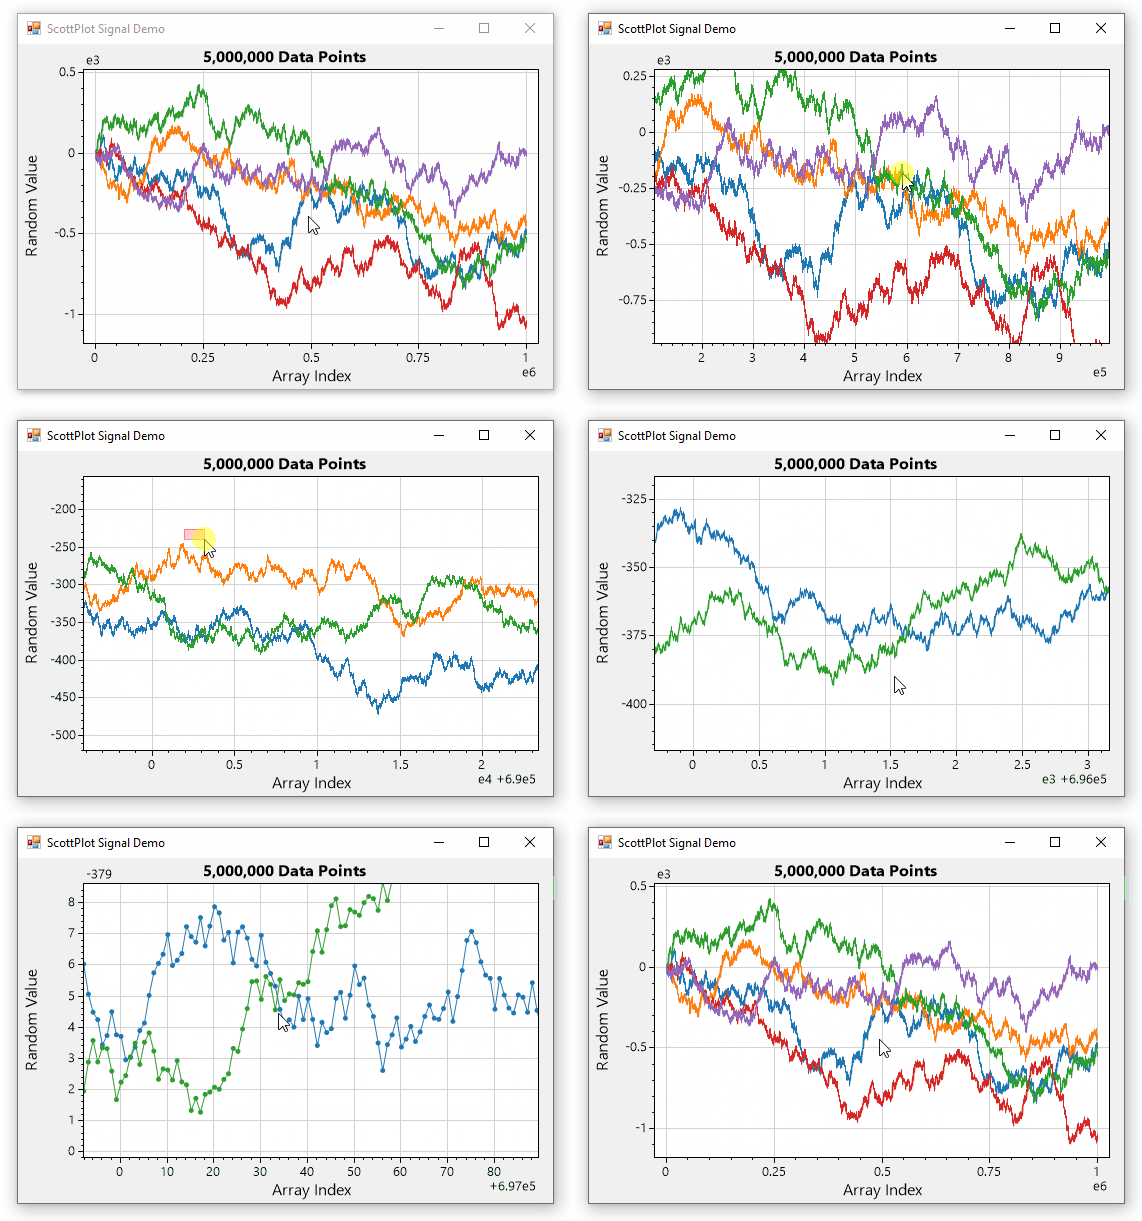
ScottPlot is a free and open-source plotting library for .NET that makes it easy to interactively display large datasets.
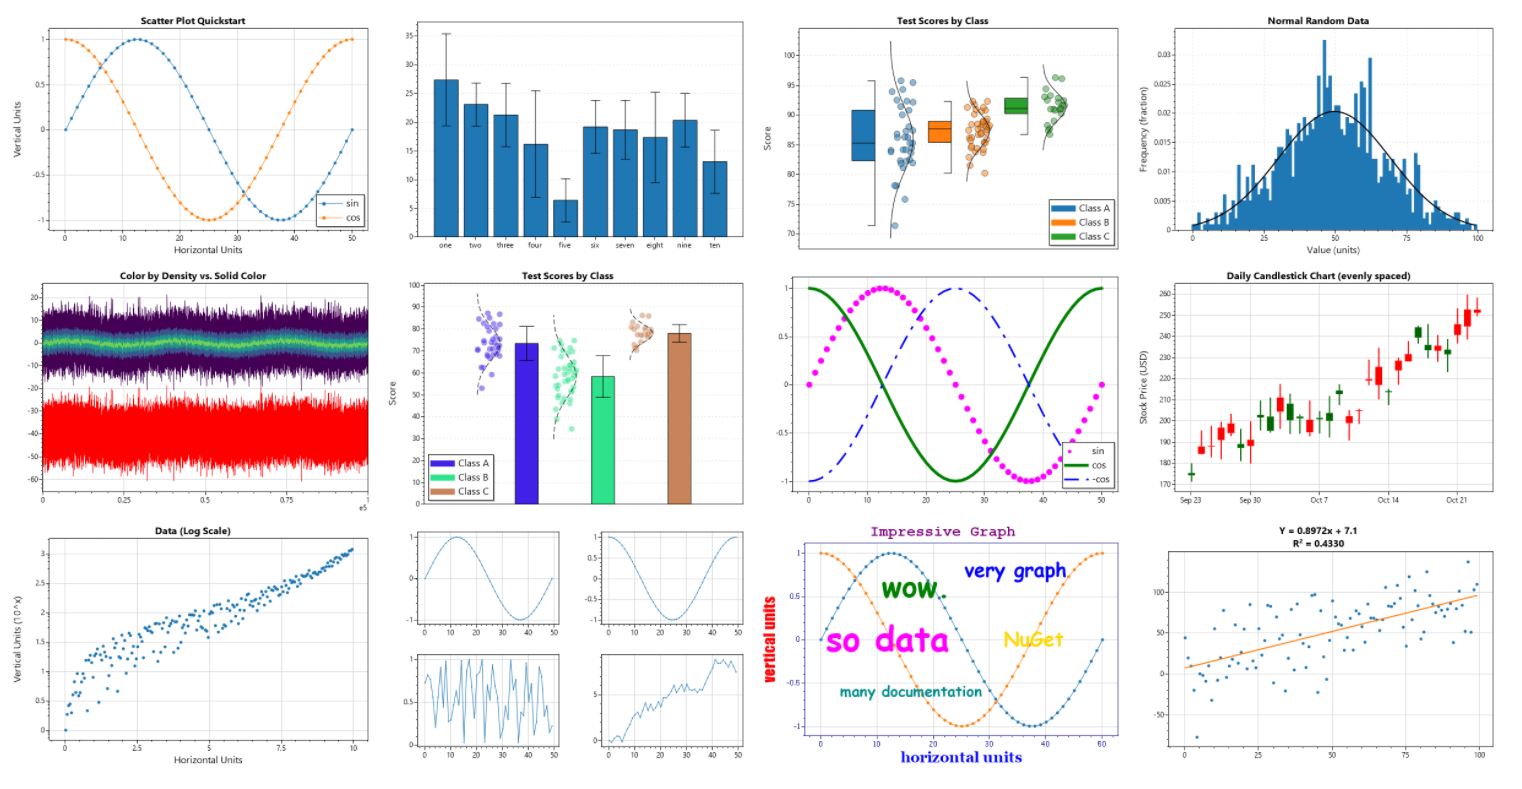
The ScottPlot Cookbook demonstrates how to create line plots, bar charts, pie graphs, scatter plots, and more with just a few lines of code.
Quickstart
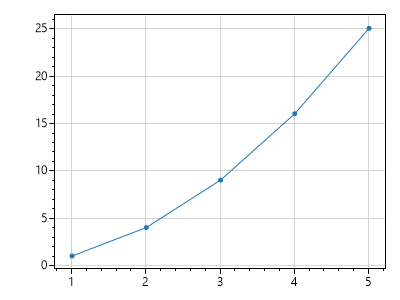
double[] dataX = { 1, 2, 3, 4, 5 };
double[] dataY = { 1, 4, 9, 16, 25 };

ScottPlot.Plot myPlot = new();
myPlot.Add.Scatter(dataX, dataY);
myPlot.SavePng("quickstart.png", 400, 300);
Windows Forms Quickstart
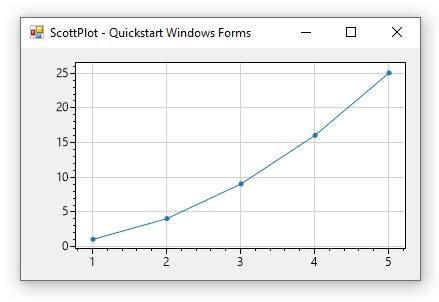
Install the ScottPlot.WinForms NuGet package, drop a FormsPlot from the toolbox onto your form, then add the following to your start-up sequence:
double[] dataX = { 1, 2, 3, 4, 5 };
double[] dataY = { 1, 4, 9, 16, 25 };

formsPlot1.Plot.Add.Scatter(dataX, dataY);
formsPlot1.Refresh();
More Quickstarts
- Console Application Quickstart
- Windows Forms Quickstart
- WPF Quickstart
- WinUI Quickstart
- Avalonia Quickstart
- Eto Quickstart
- Blazor Quickstart
- Powershell Quickstart
- Polyglot Notebook Quickstart
Interactive Demo
The ScottPlot Demo allows you to run these examples interactively.
ScottPlot Cookbook
The ScottPlot Cookbook demonstrates how to create line plots, bar charts, pie graphs, scatter plots, and more with just a few lines of code.
Versions
-
ScottPlot 5.0 is the newest version of ScottPlot. ScottPlot 5 is actively developed and supports all operating systems. The API is similar but not identical to ScottPlot 4. See the What's New in ScottPlot 5.0 page for details.
-
ScottPlot 4.1 is a stable version of ScottPlot which continues to be maintained but no longer receives major new features. ScottPlot 4 supported all operating systems through .NET 6, but after .NET 7 it can only be used in projects that target Windows.